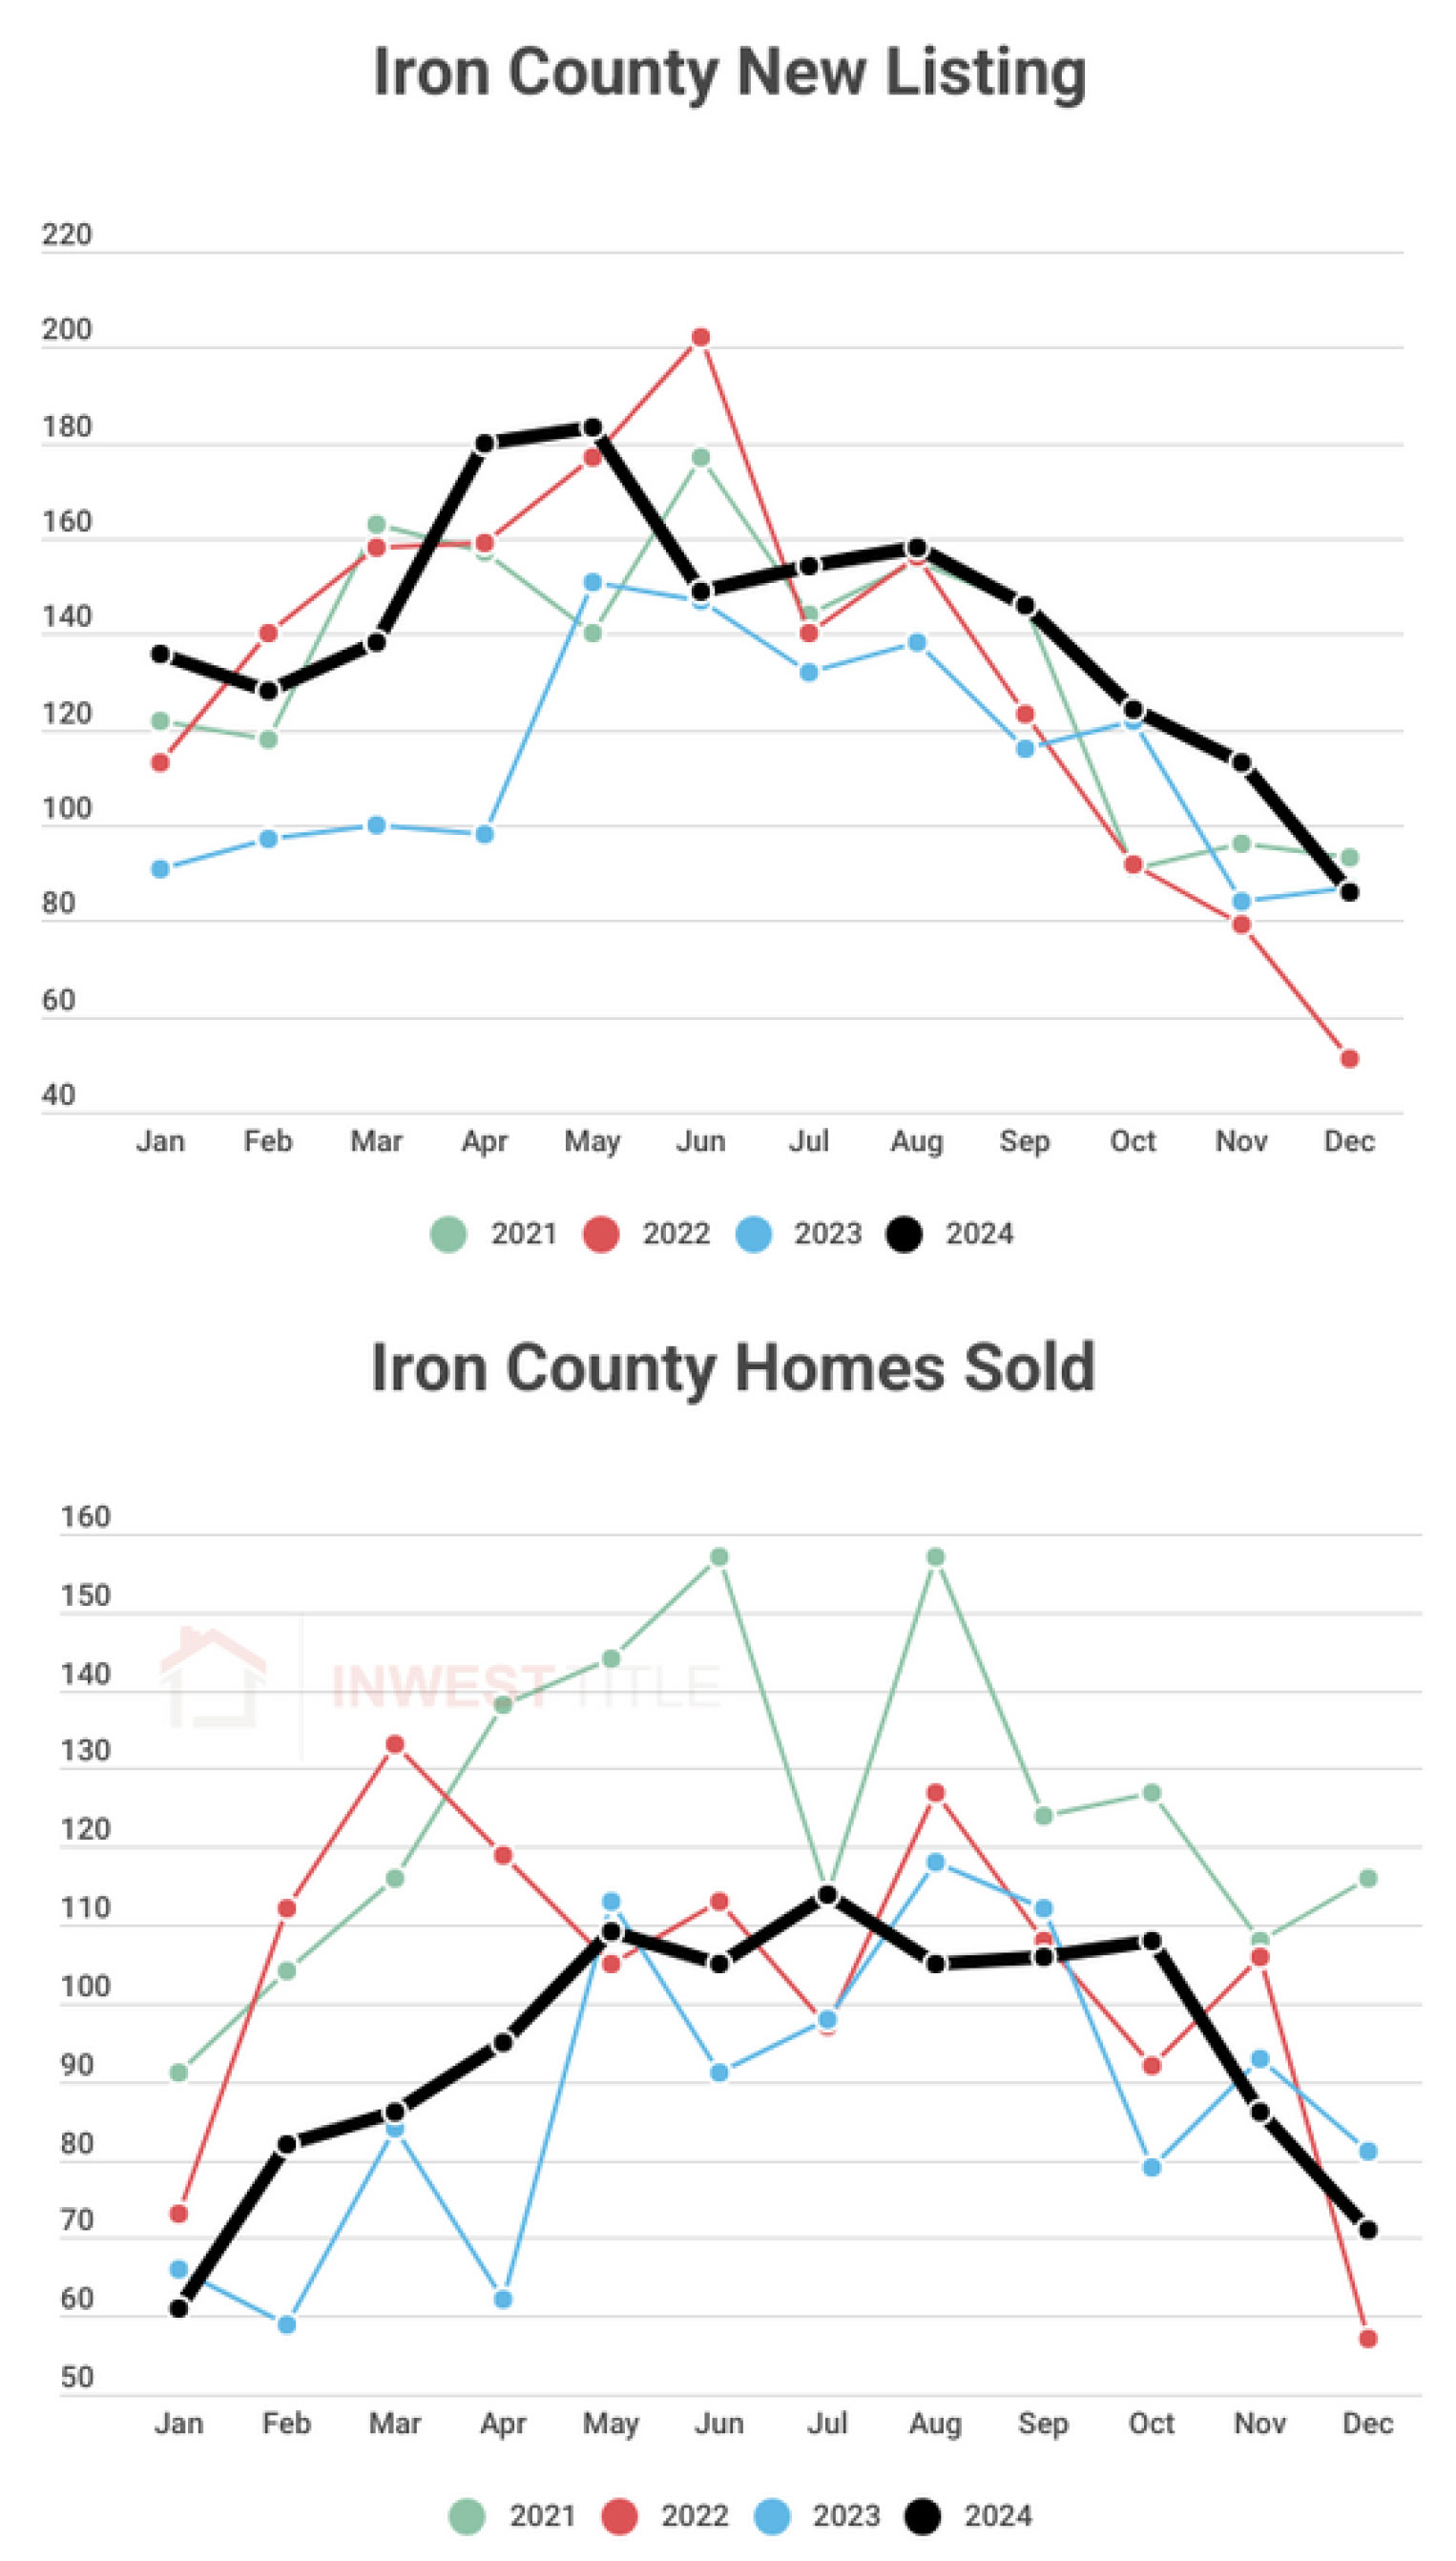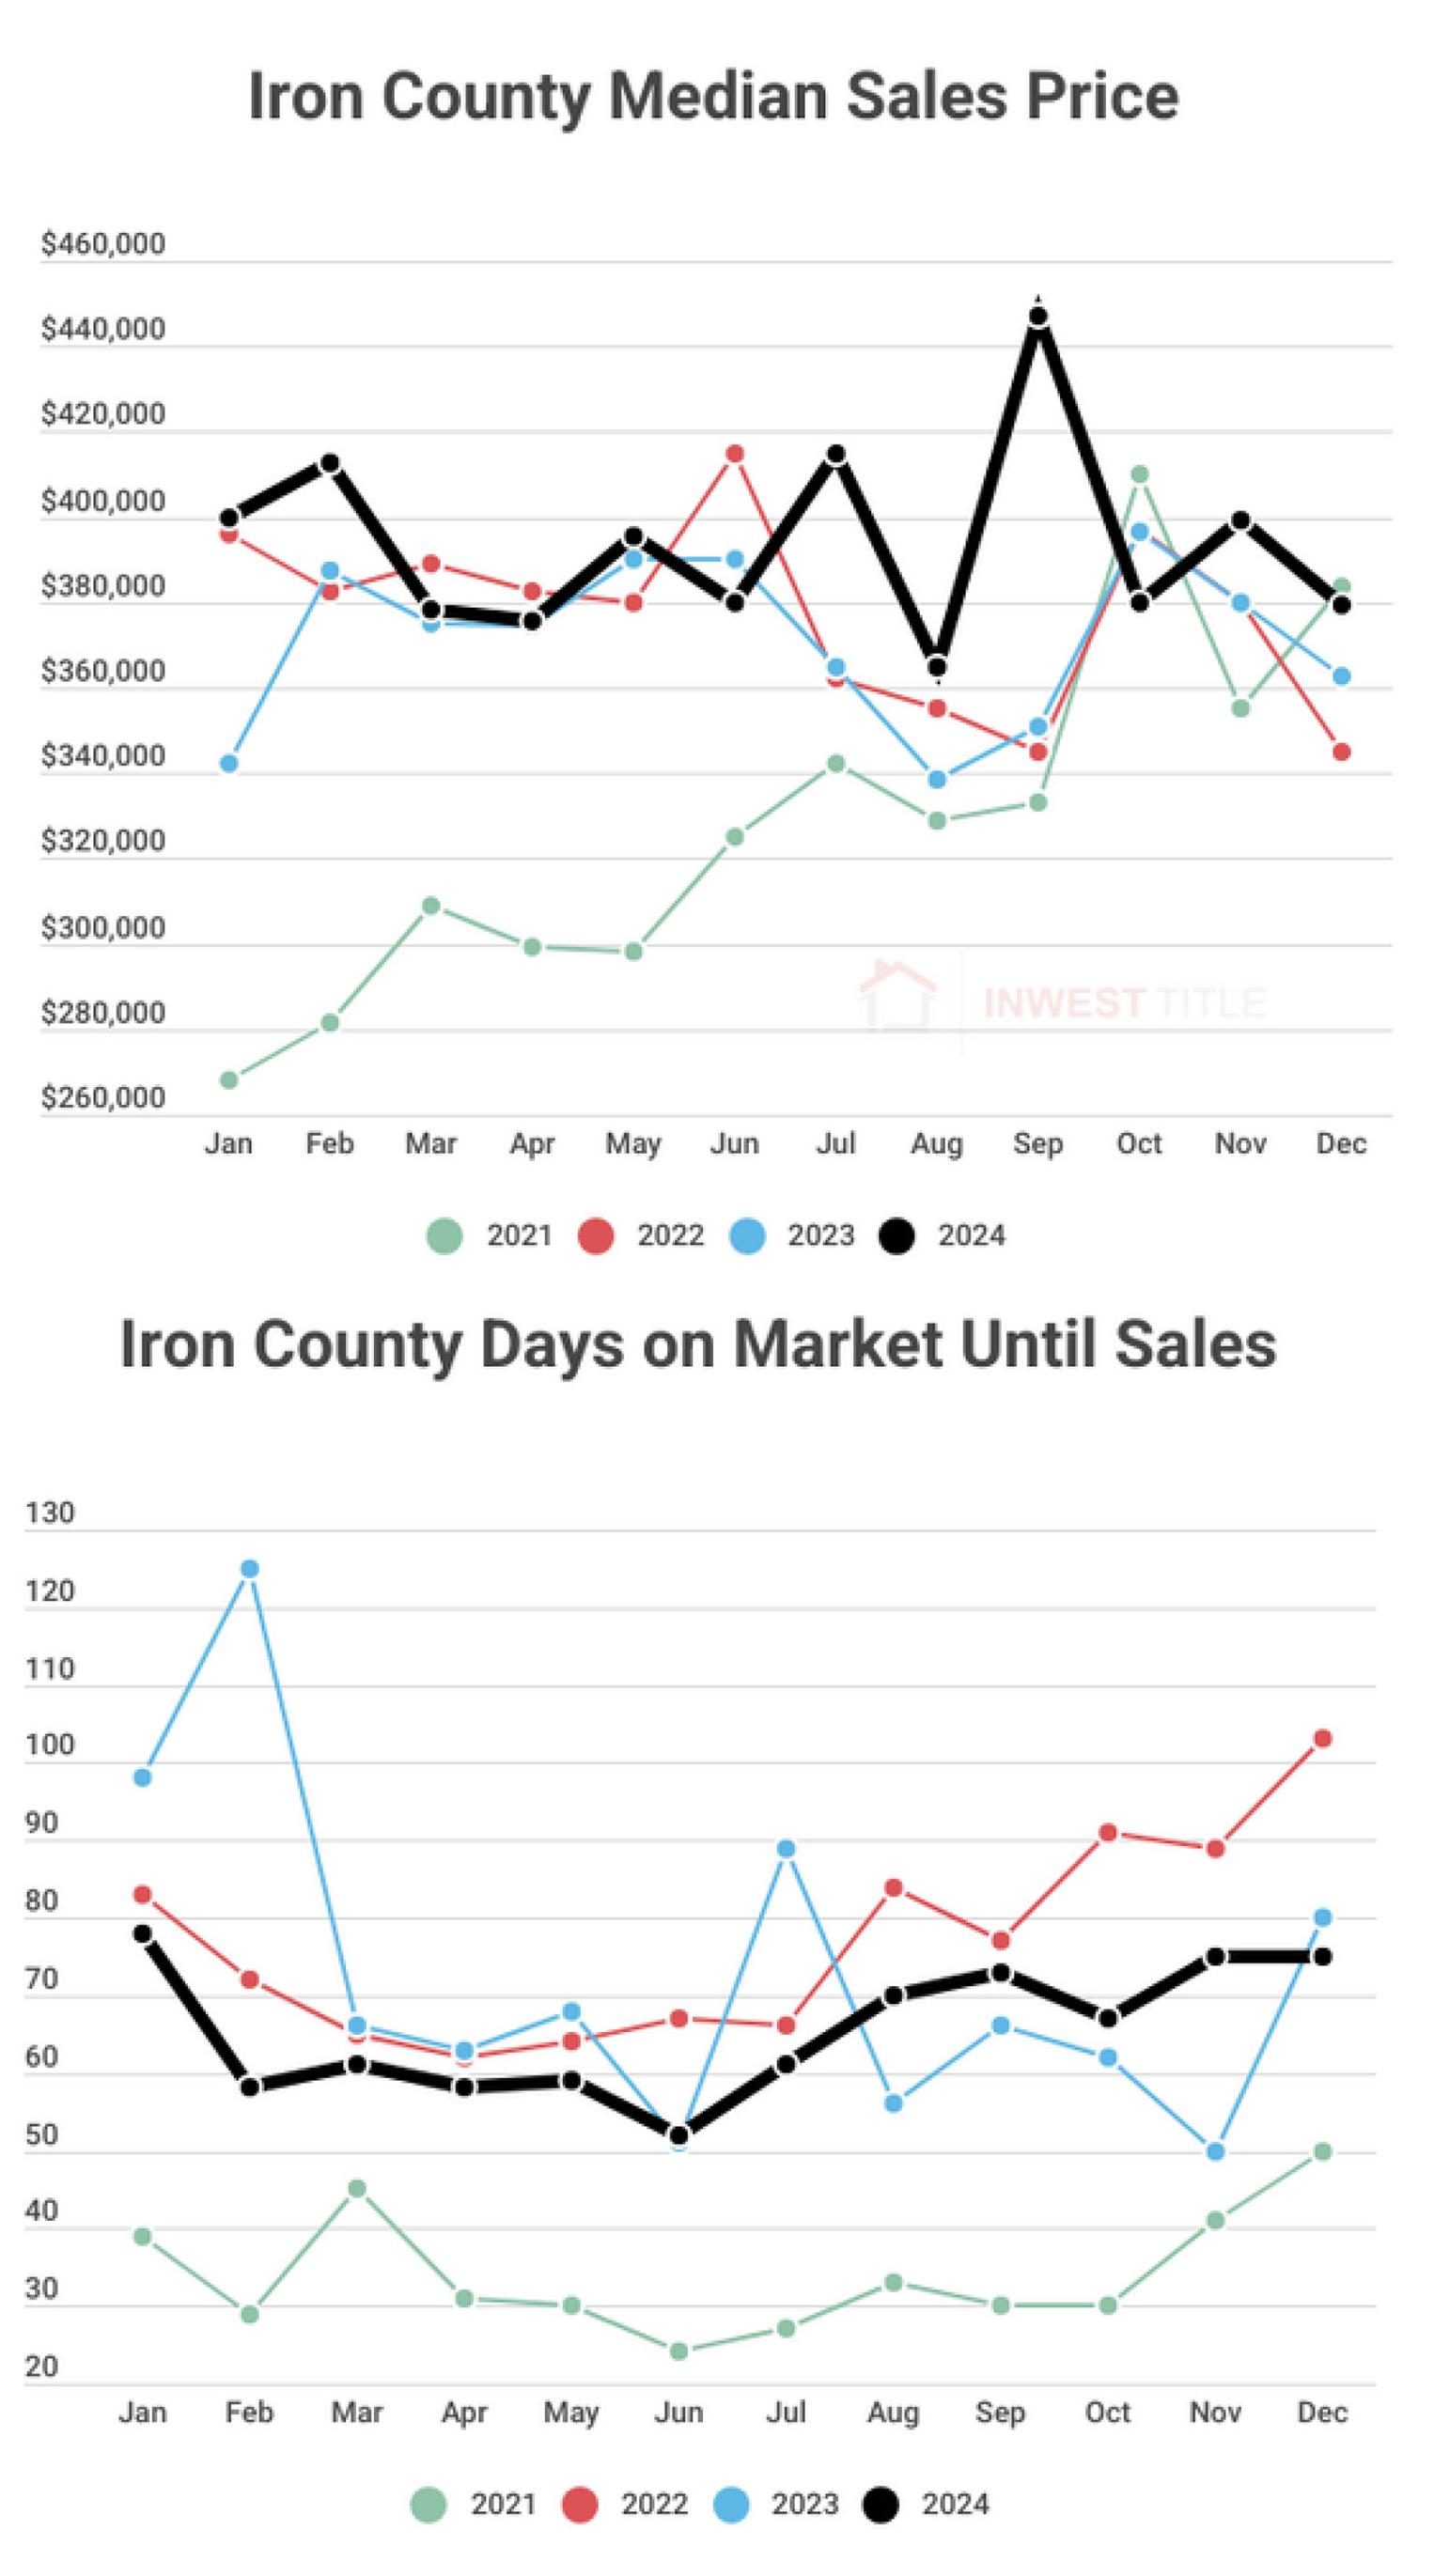
We are grateful to Inwest Title for the above and below graphs showing how the Iron County real estate market performed last year, compared with recent years, setting the scene of where we are at, as the market really gets underway in 2025.
We'll analyse each graph individually:
Median Sales Price
2022 marked the peak of the post Covid-era boom in our area, from a sales price perspective, and it's notable that median sales prices last year challenged those highs, and mostly exceeded them across the year. We can also see a significant general improvement on 2023 prices. This bodes well for potentially even better returns for sellers in 2025.
Days On Market Until Sales
2021 saw amazing Covid-era demand and quite exceptionally low average days on market until a home was sold. The black line for 2024 shows an extremely encouraging trend for a reduced selling period, compared with either of the last couple of years. It's a very good sign of excellent buyer sentiment, even though mortgage rates aren't where anyone would like to see them. There's wider recognition that it's better to find the home you want, then refinance when rates do significantly fall.
New Listings
Last year saw a quite large difference between the highest number of listings and the lowest, across the 12-month spectrum. Less choice does usually mean that prices are higher, due to lower supply, so this unquestionably influenced the generally higher median sales price profile for last year. With that said, there are seasonal variations at play here and it should be noted that listings were near a multi-year high in late spring. The low number of listings at the end of the year isn't especially significant, as the graph amply demonstrates that December almost invariably represents the low point in the annual cycle in terms of available inventory.
Homes Sold
The first half of 2024 saw impressive month-on-month growth in sales. Things pretty much leveled out until the fall and then we saw the traditional decline through the holidays to year end. The inevitable uncertainties leading up to the election in November may also have delayed some purchases. Nonetheless, we've started 2025 in a stronger position than at the beginning of last year and should expect similar progressive growth each month, as home buying interest accelerates as spring and summer approaches.
In conclusion, these very informative graphs show the cyclical nature of our market across the year. There's every expectation that buyers will again be out in large numbers as the busy selling period really gets under full steam. If this upturn in activity is matched by what everyone hopes to see with mortgage rates heading south, then it could be a very good year indeed.
As always, please feel free to contact us at 435-327-2090 to discuss your best options in current and likely future market conditions.